Best WordPress Chart Plugins in 2026: 7 Tools Compared
WLWPLegible EditorsLast verified 22 Nov 2026How we rank11 min read
★ Short answer
Visualizer is the best overall WordPress chart plugin, combining 20,000+ active installs, a built-in AI chart generator, and 15+ chart types on its $199/yr Pro tier. For massive SQL or spreadsheet datasets, pick wpDataTables, while M Chart and Ninja Charts are completely free options.
How we make this list: we compare pricing pages, product documentation and public user reviews, then re-check every price before each update. No product paid for a place. Disclosure.
Visualizer ($199/yr regular, often $99/yr on sale) offers 4 free chart types and an AI prompt builder across 20,000+ active installs.
wpDataTables leads in adoption with 60,000+ active installs and supports 80+ chart types across 5 rendering engines.
Chartify ($75 one-time regular) includes 20+ chart types and Google Sheets sync without recurring annual renewals.
M Chart (4.9 stars, 3,000+ installs) and Ninja Charts (3,000+ installs) have zero paid tiers and keep all features free.
Graphina ($99 one-time on CodeCanyon) targets Elementor users with 14+ chart types built on ApexCharts.
What to look for in a WordPress chart plugin
Static chart images break on mobile screens and force you to re-export files every time a number changes. A dedicated WordPress chart plugin renders responsive HTML5 or SVG visuals using libraries like Chart.js, Google Charts, or ApexCharts so tooltips, legends, and scaling adapt to every viewport.
Data entry workflow matters more than raw chart count. If you publish occasional blog graphics, manual spreadsheet-style entry inside WordPress is plenty. If you track financial metrics, inventory, or survey results, look for CSV imports, Google Sheets live sync, or direct MySQL query builders so charts update automatically.
Watch how plugins gate chart types and data sources. Many freemium tools include basic bar, line, and pie charts for free but lock scatter plots, geo maps, and automated Google Sheets syncing behind annual or one-time licenses.
4.4/5on WordPress.org (228 reviews, checked Nov 2026)
Paid from$199/yr
Best overall for everyday charts
Chart types4 free, 15+ Pro
RenderingGoogle Charts, Chart.js
Data sourcesManual, CSV, Excel, Sheets, DB
EditorsBlock editor, Elementor, Shortcode
themeisle.com
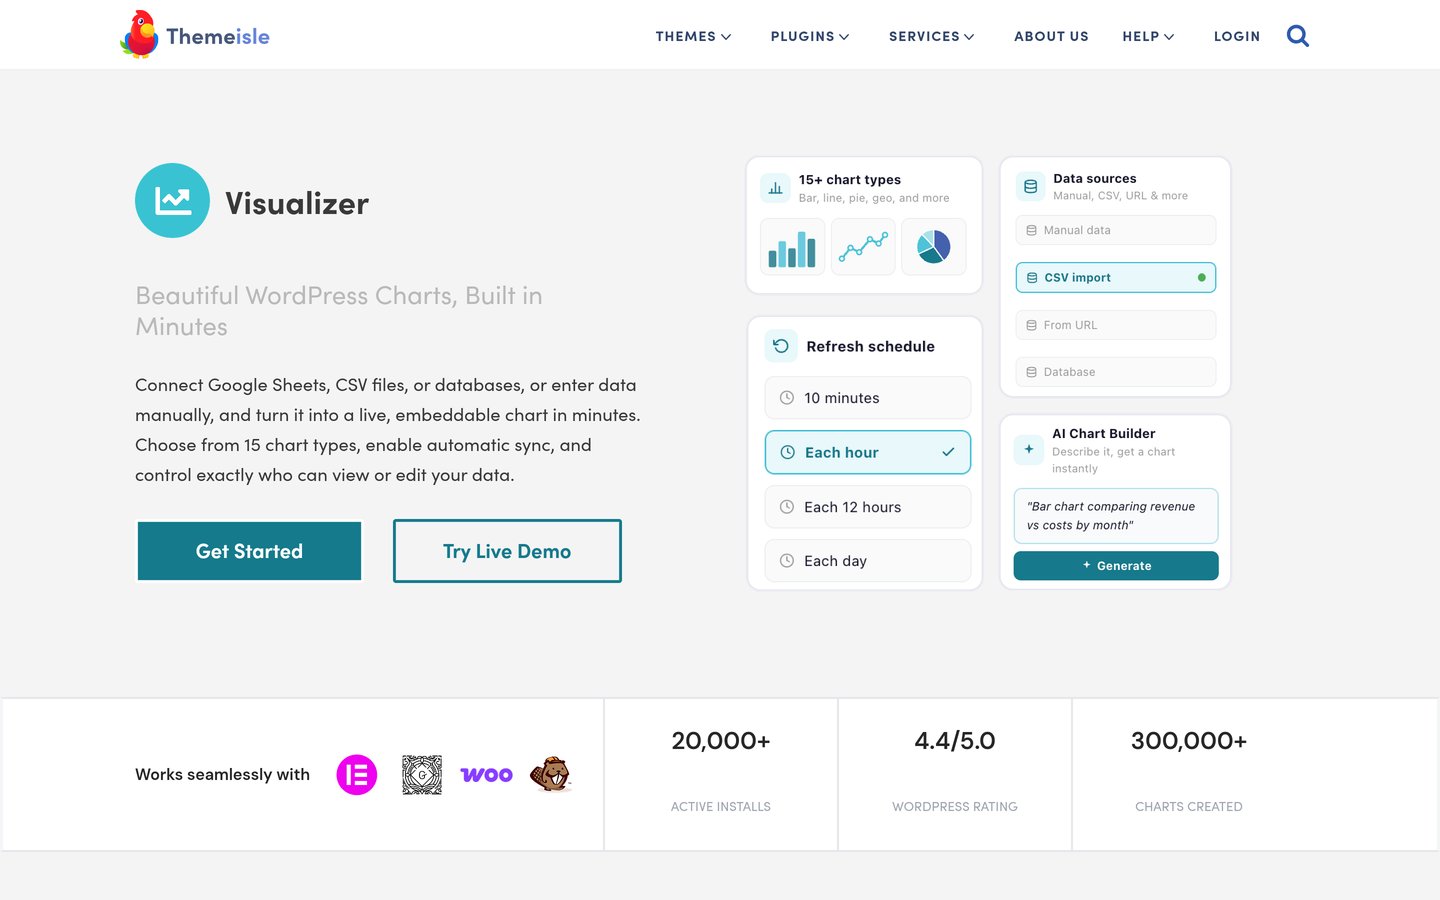
Visualizer homepage, captured Nov 2026.
Visualizer is a WordPress chart and table manager by Themeisle with 20,000+ active installations. Its free plugin includes four core formats—line, bar, pie, and table—alongside an AI chart generator that turns plain text prompts into responsive HTML5/SVG visuals without external API keys.
The trade off is that advanced formats like geo, scatter, area, and candlestick charts plus scheduled Google Sheets and database syncing require the Pro plan at $199/yr regular price (frequently discounted to $99/yr). It suits bloggers, educators, and marketers wanting fast setup.
What we like
Built-in AI generator creates charts from text prompts in the free version
Supports CSV, Excel, Google Sheets, JSON URLs, and database queries in Pro
Clean live preview and responsive HTML5/SVG rendering
Watch out for
Free tier is limited to 4 basic visualization types
Regular $199/yr renewal is steeper than one-time competitors
Pro ($199/yr regular) unlocks 15+ chart types, live Google Sheets sync, and database imports.Visit themeisle.com
02
wpDataTables
4.5/5on WordPress.org (449 reviews, checked Nov 2026)
Paid from$59/yr
Best for large datasets & SQL
Chart types80+ across 5 engines
RenderingGoogle, Chart.js, Highcharts, Apex
Data sourcesExcel, CSV, JSON, Sheets, MySQL
Large dataServer-side processing
wpdatatables.com
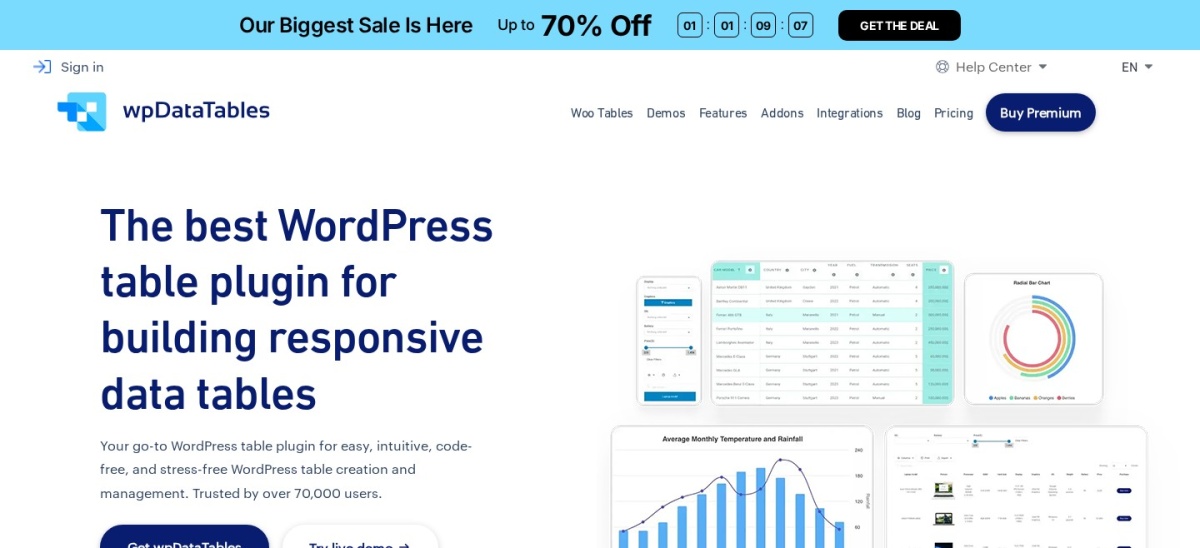
wpDataTables homepage, captured Nov 2026.
wpDataTables is a data table and charting plugin with 60,000+ active installations and 449 WordPress.org ratings. The free Lite version connects to Excel, CSV, XML, and JSON files and renders responsive line, bar, and pie charts via Google Charts and Chart.js.
The trade off is complexity and gated enterprise engines: Highcharts, ApexCharts, MySQL query builders, and front-end table editing require paid tiers starting at $59/yr for Starter (1 domain). It suits analysts, directories, and stores managing thousands of rows.
What we like
Charts update dynamically when underlying table data or filters change
Server-side processing handles massive datasets without slowing page loads
Supports 80+ chart variations across five JavaScript libraries
Watch out for
Interface has a steeper learning curve for simple single-post charts
SQL database connections and Highcharts require paid tiers
Starter ($59/yr) adds Google Sheets API sync, conditional formatting, and server-side processing.Visit wpdatatables.com
03
M Chart
4.9/5on WordPress.org (28 reviews, checked Nov 2026)
PriceFree
Best 100% free Chart.js plugin
Chart typesLine, bar, pie, radar, polar
RenderingBundled Chart.js library
Data sourcesSpreadsheet UI, CSV import/export
Pricing100% free open source
wordpress.org
M Chart homepage, captured Nov 2026.
M Chart is a free, open-source WordPress plugin holding a 4.9-star rating across 28 reviews and 3,000+ active installations. It embeds a spreadsheet-style data grid right inside the WordPress post editor and renders responsive charts using the bundled Chart.js library.
The trade off is the lack of automated live data feeds from external Google Sheets or SQL databases—you enter numbers manually or upload CSV files. It suits editorial teams and developers who want clean, zero-cost charts with developer filter hooks.
What we like
Completely free with no upsells, locked chart types, or license keys
Familiar spreadsheet-like grid inside WordPress with CSV import and export
High 4.9-star user rating and active maintenance
Watch out for
No automatic syncing with live Google Sheets or external APIs
Fewer decorative templates than commercial page-builder addons
All spreadsheet editing, CSV import/export, and Chart.js features are included free.Visit wordpress.org
04
Chartify
4.9/5on WordPress.org (28 reviews, checked Nov 2026)
Paid from$75 one-time
Best one-time license option
Chart types20+ including Gantt & Org
Data sourcesManual, CSV, Google Sheets, SQL
IntegrationsWooCommerce, Quiz Maker
LicenseOne-time payment (5 sites)
ays-pro.com
Chartify homepage, captured Nov 2026.
Chartify by AYS Pro is a WordPress chart builder with 3,000+ active installations and a 4.9-star rating across 28 reviews. Its free version supports manual data entry and core formats like pie, bar, column, and line charts with live dashboard previews.
The trade off is that CSV imports, Google Sheets live syncing, SQL queries, and specialized formats like Gantt, Sankey, and organizational charts require the Business license at $75 one-time regular price (often on sale for $39). It suits agencies avoiding annual subscriptions.
What we like
One-time payment covers up to 5 websites with lifetime plugin usage
Includes niche formats like organizational, Gantt, Sankey, and candlestick charts
Connects directly to Google Sheets and WooCommerce data in Pro
Watch out for
Business tier includes 12 months of updates and support unless upgraded to Developer
Free version restricts data entry to manual input
Business ($75 one-time regular) unlocks 20+ chart types, Google Sheets, CSV, and SQL sources.Visit ays-pro.com
05
Ninja Charts
3/5on WordPress.org (6 reviews, checked Nov 2026)
PriceFree
Best free companion for Ninja Tables
Chart types10+ types
RenderingChart.js, Google Charts
IntegrationsNinja Tables, Fluent Forms
Pricing100% free plugin
wordpress.org
Ninja Charts homepage, captured Nov 2026.
Ninja Charts is a completely free visualization plugin from the WPManageNinja team with 3,000+ active installations. It offers more than 10 responsive chart types powered by Chart.js and Google Charts, working both standalone via manual input and alongside Ninja Tables or Fluent Forms.
The trade off is a mixed 3.0-star rating across 6 reviews and fewer standalone external connectors if you do not already use Ninja Tables Pro for Google Sheets or SQL feeds. It suits existing Ninja Tables and Fluent Forms users.
What we like
Zero cost with 10+ chart types unlocked out of the box
Pulls data directly from Ninja Tables and Fluent Forms submissions
Choice of Chart.js or Google Charts rendering engines
Watch out for
Small review sample with a 3.0-star average on WordPress.org
Advanced external data sources depend on pairing with Ninja Tables Pro
All 10+ chart types and Ninja Tables integrations are free with no separate paid tier.Visit wordpress.org
06
Graphina
4.1/5on WordPress.org (16 reviews, checked Nov 2026)
Paid from$99 one-time
Best for Elementor page builders
Chart types14+ with 1,000+ variations
RenderingApexCharts, Google Charts
Page builderNative Elementor widgets
Data sourcesManual, CSV, Sheets, SQL, API
codecanyon.net
Graphina homepage, captured Nov 2026.
Graphina by Iqonic Design is an Elementor chart addon with 9,000+ active WordPress.org installations and a 4.1-star rating across 16 reviews. The free plugin adds 14+ ApexCharts-powered widgets directly inside the Elementor sidebar with visual styling controls for colors, tooltips, and animations.
The trade off is tight coupling to Elementor and gating dynamic data sources—CSV, Google Sheets, SQL, and REST API connections require Graphina Pro at $99 one-time on CodeCanyon (2,350+ sales). It suits Elementor designers wanting granular visual controls.
What we like
Native Elementor widget controls for typography, colors, and animations
One-time $99 CodeCanyon license for Pro dynamic data features
Supports SQL, Google Sheets, Firebase, and API feeds in Pro
Watch out for
Requires Elementor; not built for standalone Gutenberg workflows
Dynamic external data imports are locked behind the Pro addon
Graphina Pro ($99 one-time) unlocks Google Sheets, CSV, SQL, API, and dynamic Elementor tags.Visit codecanyon.net
07
Data Tables Generator
4.7/5on WordPress.org (497 reviews, checked Nov 2026)
Paid from$49/yr
Best for spreadsheet formulas + charts
Chart typesLine, bar, pie, area, bubble
EditorExcel-like grid with formulas
Data sourcesPaste, CSV, Excel, Sheets, SQL
Large tablesFree server-side processing
wordpress.org
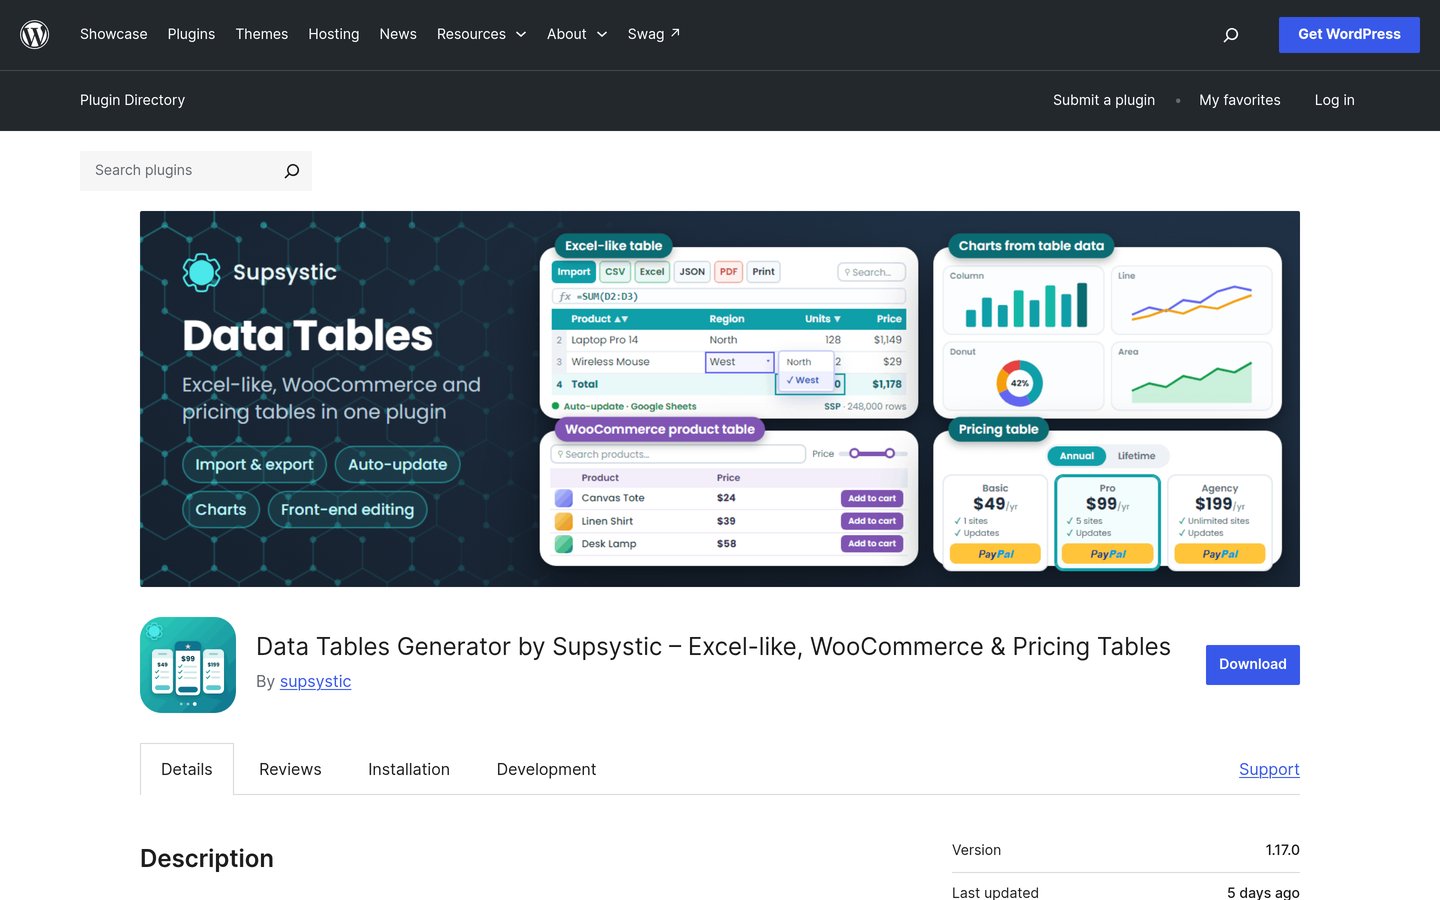
Data Tables Generator homepage, captured Nov 2026.
Data Tables Generator by Supsystic is a spreadsheet-style WordPress plugin with 10,000+ active installations and a 4.7-star rating across 497 reviews. Its free version includes unlimited tables, Excel formulas like SUM and AVERAGE, and server-side processing for large datasets.
The trade off is that converting those table rows into line, bar, pie, area, and bubble charts—along with Google Sheets auto-sync and MySQL queries—is a Pro feature starting at $49/yr. It suits sites that need spreadsheet calculations feeding directly into charts.
What we like
Supports Excel-style formulas and merged cells inside WordPress
Strong 4.7-star average across nearly 500 WordPress.org reviews
Charts update automatically when table cells or Google Sheets change
Watch out for
Diagram and chart generation requires upgrading to the Pro version
Fewer specialized chart formats than Visualizer or Chartify
Pro ($49/yr) unlocks charts and graphs from table rows, Google Sheets sync, and SQL queries.Visit wordpress.org
Chart.js vs. Google Charts vs. ApexCharts
Most WordPress chart plugins are wrappers around open-source JavaScript libraries. Chart.js (used by M Chart, Visualizer, and wpDataTables) renders crisp HTML5 canvas graphics with smooth hover animations and minimal script weight, making it ideal for blogs and editorial reports.
Google Charts (used by Visualizer, wpDataTables, and Ninja Charts) renders SVG visuals and excels at geo maps, organizational trees, and timelines. ApexCharts (used by Graphina) offers modern interactive zooming and pan controls suited for financial dashboards.
How we chose
We evaluated WordPress chart and data visualization plugins listed in the official WordPress.org repository and major marketplaces, prioritizing tools with at least 3,000 active installations and active updates in 2026.
All active installation figures, star ratings, review counts, and entry-level regular prices were verified on 22 Nov 2026 directly from WordPress.org plugin pages, vendor pricing pages, and CodeCanyon listings.
We excluded abandoned plugins not updated within the past 12 months, single-purpose stock ticker widgets, and plugins with fewer than 1,000 active installs. No vendor paid for a place, and we do not claim testing for this list.
How to pick the right WordPress chart plugin
Match your data workflow and editor setup to the right tool in four steps.
Decide between manual entry and live data sync. If you only update charts once a quarter, a free tool with manual spreadsheet entry or CSV upload like M Chart saves money. If numbers change weekly, choose a Pro plan with automatic Google Sheets or MySQL syncing.
Check your required chart formats before installing. Every plugin on this list handles bar, line, and pie charts. If you need geo maps, Gantt timelines, candlestick charts, or organizational trees, verify those specific formats are included in your target tier.
Match the plugin to your page builder. Block editor users get the cleanest experience with Visualizer or M Chart, while Elementor sites benefit from Graphina's native sidebar styling controls.
Compare annual renewals against one-time licenses. Plugins like Visualizer and wpDataTables bill annually for ongoing updates, whereas Chartify and Graphina offer one-time payments if you prefer avoiding recurring fees.
FAQ
What is the best completely free WordPress chart plugin?
M Chart and Ninja Charts are completely free on WordPress.org with no paid upgrades. M Chart offers a 4.9-star rating and spreadsheet-style Chart.js editing, while Ninja Charts integrates directly with Ninja Tables and Fluent Forms.
Can I connect Google Sheets to a WordPress chart?
Yes, several plugins sync live with Google Sheets so charts update when your spreadsheet changes. Visualizer Pro, wpDataTables Starter, Chartify Business, and Graphina Pro all include Google Sheets integration.
Are WordPress chart plugins responsive on mobile phones?
Modern chart plugins use HTML5 Canvas or SVG libraries like Chart.js, Google Charts, and ApexCharts. These automatically resize charts, adjust axis labels, and enable touch-friendly tooltips on smartphones and tablets.
Do chart plugins slow down WordPress page speed?
Well-coded plugins load their JavaScript rendering libraries only on posts or pages containing a chart shortcode or block. Keeping datasets under a few thousand rows—or using server-side processing in wpDataTables—prevents browser lag.
Which WordPress chart plugin works best with Elementor?
Graphina is built specifically for Elementor and provides native sidebar widgets with granular typography, color, and animation settings. Visualizer and wpDataTables also offer Elementor compatibility alongside Gutenberg blocks.